英语写作技巧:静态图模板
第一段:图表描述
According to the statistics given above,we may conclude that the recruitment of主题词was on a steady rise/decline from 年份 to 年份.In 年份,the number was at a low of only about数字. Surprisingly, it reached/reduced差值in年份,within no more than seven years.(40词)
第二段:分析原因(同动态图模板)
Some driving factors that contribute to the above- mentioned changes may be summarized as follows.【原因一】First and foremost, as a matter of fact, with the rapid development of our economy and society , the ......(经济发展原因适用于99%的问题)【原因二】In addition, we must admit that this tendency also has a lot to do with ......【原因三】Last but not least, working pressure is another reason.(生活工作压力方面的原因80%都适用)(57词)
第三段:给出建议(动静图灵活运用)
It is necessary for us to take effective measures to ensure this situation doesn’t get out of hand,and ......(措施)(19词)
翻译:上述统计数据,我们可以得出结论...从...年到年处于一个平稳的上升/下降。在...年,这个数值很低大约只有..., 令人惊讶的是,它达到/减少到..在...年,不超过七年。
促成上述变化的一些驱动因素可以总结如下。首先事实上,随着我国经济社会的快速发展...., 此外,我们必须承认,这种倾向也与··...·有很大关系。最后但同样重要的是,工作压力是另一个原因。
我们有必要采取有效措施,确保这种情况不会失控......
作文地带提示:大作文要求150词,只看模板就100多个词了,自己只要填上关键词关键句就可以了,绝对不用担心字数不够。
英语作文高分模板:静态图表
As is shown in the …chart,we can notice the percentages of 事件+时间+地点。 From the statistics given,we may draw the conclusion that the percentage of 占 比 最大的子项目标题 is the highest among all the categories,accounting for 最大值 and 占比第二的子项目标题 comes next,accounting for 第二大值,while/whereas 剩余子标题 account for 剩余子标题的对应数值 respectively.
What the chart informs us is that the percentage of 最大的子项目标题 plays ε significant role in 事件(名词/名词短语/doing…).What accounts for this scenario?At least,for my part,two major factors contribute to it.Firstly,the reason why 最终结 果(句子)is that 原因(句子),which 直接结果(动词/动词短语).Secondly,this change that 最终结果(句子) has a lot to do with the fact that 原因(句子), which 直接结果(动词/动词短语).
Having analyzed the hidden factors in the chart,we will easily predict that the situation might remain at the same level in the few years to come.Some people should be educated or enlightened in 主题词(名词/名词短语)to avoid 消极结果(名词 /名词短语/doing…).Only in this way can we reduce the negative effects of 主题词(名词/名词短语)to the smallest extent.
雅思图表作文静态图 pie chart
静态图比较:
1. The UK consumed three times more electricity than Italy did, with 12 million kWh being used.
2. The UK's consumption (12 million) was four times higher than Italy's (3 million).
3. Up to 12 million people consumed alcohol in the UK, quadrupling the amount in Italy.
4. With a high of 12 million, the UK's consumption tripled that of Italy.
5. The UK's consumption exceeded that of Italy by three times.
6. The UK's consumption reached up to 12 million, surpassing that of Italy (3 million).
表示占比
account for/ represent/ constitute / occupy/ make up/ be shared by/ be responsible for
Breeding and farming accounted for the main proportion of damage in 2008, with 25%.
The cost rose dramatically in 2011, representing 23% of the school budget.
或者
In 2008, farming and breeding constituted the largest percentage of damage—25%.
2011 saw a sharp increase in expenses, accounting for 23% of the school budget.
表对比
表示倍数:
double/ triple
be(twice/ three times) as (high/ much/ many) as
A is ...times as (much/many) as B
the number or percentage) had doubled or tripled) by the year
The use of mobile phones doubled between 1990 and 2000
Sales in Switzerland tripled from 3 million euros to 9 million euros.
远高于:
be significantly or significantly higher than/ outnumber
Oxford's gross value is estimated at $30,800, significantly higher than the national average of 20,300.


如下例文供大家参考:
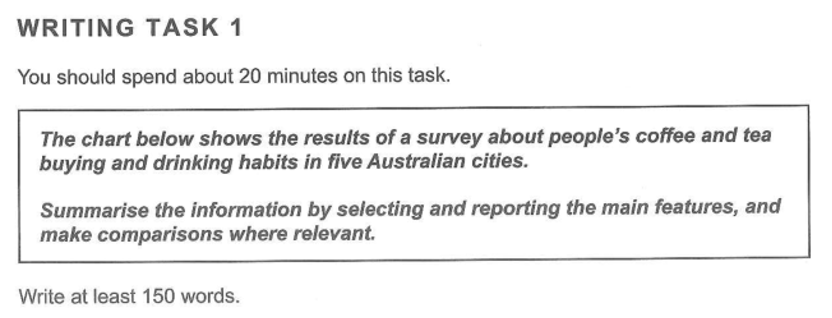
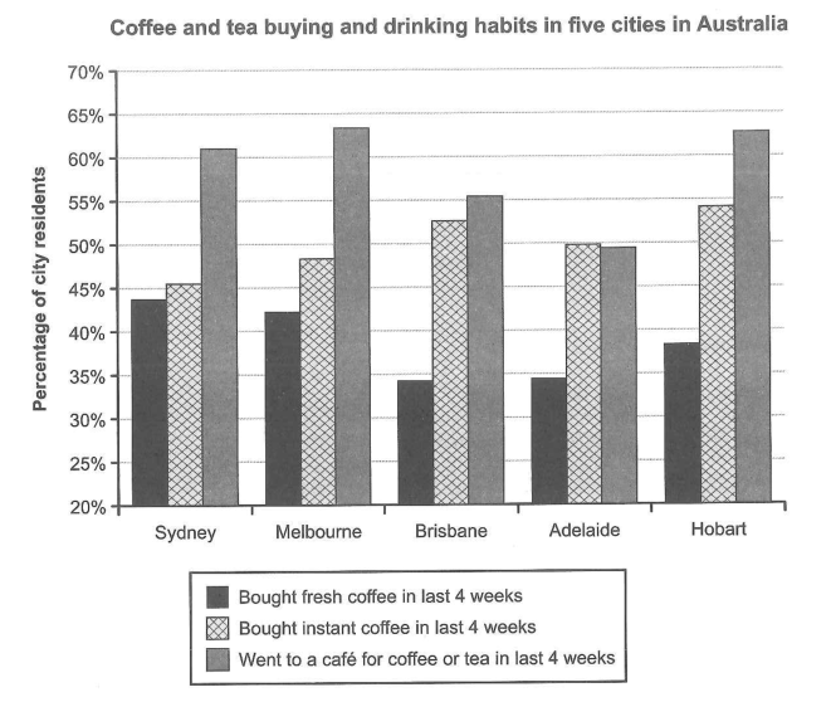
The statistics (measured as a percentage) of people’s drinking and buying habitson coffee and tea in five Australian cities from a survey is indicated by this bar chart.
To begin with, 44% residents in Sydney bought fresh coffee in last 4 weeks, a bit higher than Melbourne (43%) and Hobart (38%) respectively. Nearly 35% of people living in Adelaide did the same thing, slightly more than Brisbane (34%).
Additionally, in terms of those who bought instant coffee in last 4 weeks, figures of all five cities are higher than 45%, with Hobart accounting for the highest proportion at 54%, followed by Brisbane (53%), Adelaide (50%), Melbourne (48%) and Sydney (46%) in a decreasing order.
More interestingly, as for people who went to a café for coffee or tea in last 4 weeks, proportions of 4 cities are more than a half, with Melbourne occupying the largest percentage at 64%, Hobart 63%, Sydney 61%, and Brisbane a little more than 55%. Meanwhile, the figure of Adelaide is a slightly lower than 50%.
In summary, in 4 cities excluding Adelaide, the most popular habit is going to a café for coffee or tea since related figures are noticeably higher than the other two options. In the meantime, in Adelaide instant coffee is prevalent because almost half local people chose it during last 4 weeks. In contrast, purchasing fresh coffee is the last choice for people in all these 5 cities.
编辑:Liuxuepaper.Com


文档为doc格式


