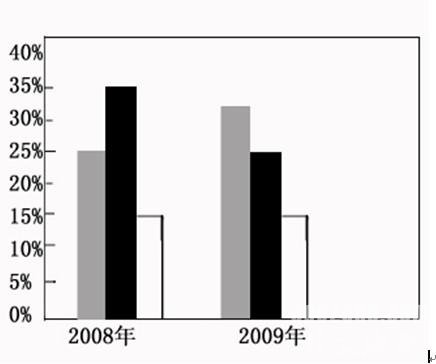
write a short essay baesd on the following chart.in your writing,you should:
1)interpret the chart and
2)give your comments
you should write at least 150 wrods
write your essay on answer sheet 2(15points)

2008、2009年国内轿车市场部分【品牌份额示意图】
As can be seen clearly from the chart, the market share taken by domestic car brands increased rapidly from 25% in 20008 to nearly 35% in 2009, while conversely, the market share owned by Japanese car brands dropped by 10% from 35% in 2008 to 25% in 2008. What’s more, the market share taken by American car brands is on the upward trend, from 10% to nearly 15%.
Three reasons, in my opinion, can account for the changes in car market in these two years. First, the rise of Chinese cars is of little surprise as we have seen Chinese enterprises’ commitment to developing self-owned technologies, which not only free them from potential risks, but also bring about long-term benefit. Second, Japanese cars, which used to be highly praised for their outstanding quality and superior stability, is now reeling from a crisis of confidence. Last, the improvement of American cars’ performance must be attributed to the smart marketing strategy employed by American sellers. They launched a lot of marketing campaigns designed specially for Chinese market, which won them applaud as well as benefit. From liuxuepaper.com.
In order to maintain the good momentum of development, domestic cars should on one hand stick to their self-independent policy, and on the other, learn some experiences from Japanese car’s failures and Americans’ success.
更多范文作文地带不断更新中……,请留意我们网站。
