友情提示:请您点击小图后,看清晰大图。

人口老龄化曲线图(作文地带提供)
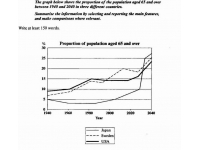
This graph reveals the proportion of the old people who are and over 65 from 1940 to 2040.
Generally the tendencies of three countries keep up though there are some differences among them. The Japanese old people aged 65 and over account for 5% in 1940 which is the lowest proportion in three countries. The situation will remain till about 2030. After that its proportion has a suddenly rise and exceed the other countries’ proportion. Till 2040, it will reach it peak of 27%.
The USA old people’s proportion is a little more than the Sweden’s. However this trend was reversed in 1999. After this year, the proportion of Sweden has a sharp rise till 2015 while the USA ‘s proportion remain a steady at the same time. From liuxuepaper.com.
In summary, before 2000 the proportions of aged people of three countries were remained under 15%. But after 2030, these proportions will exceed 20%.